

"Too many investors look at the present. The present is already in the price. You have to think out of the box and visualize 18–24 months from now, what the world is going to be and what securities might trade at. If you can see something in two years that's entirely different from the conventional wisdom, that's how you make money."
Stanley Druckenmiller
Performance Update
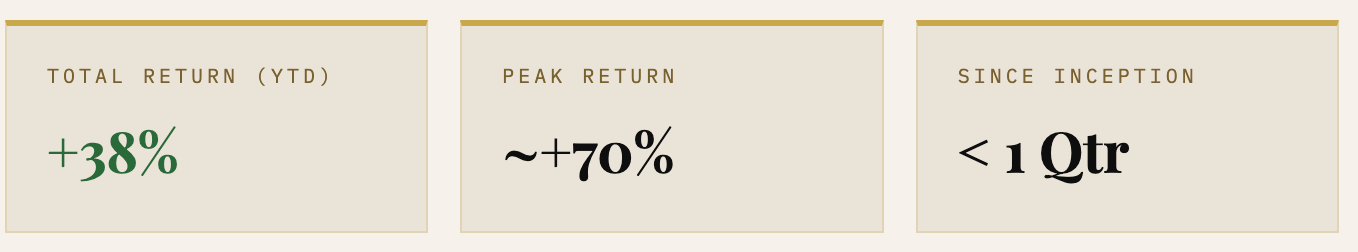
A volatile week, particularly across the gold complex. Since inception at the start of this year, the portfolio is sitting at a total return of approximately +38% on initial capital. That’s down from the peak of roughly +70% a fortnight ago, which reflects the leverage volatility inherent in the positions rather than any fundamental deterioration.
Oil positions continue to perform well, and the broader portfolio is in good shape. The volatility is concentrated in the gold positions — which is to be expected given the leverage applied. The key distinction: this is mark-to-market noise, not capital loss.
Is the Gold Bull Market Still Intact?
Short answer: yes.
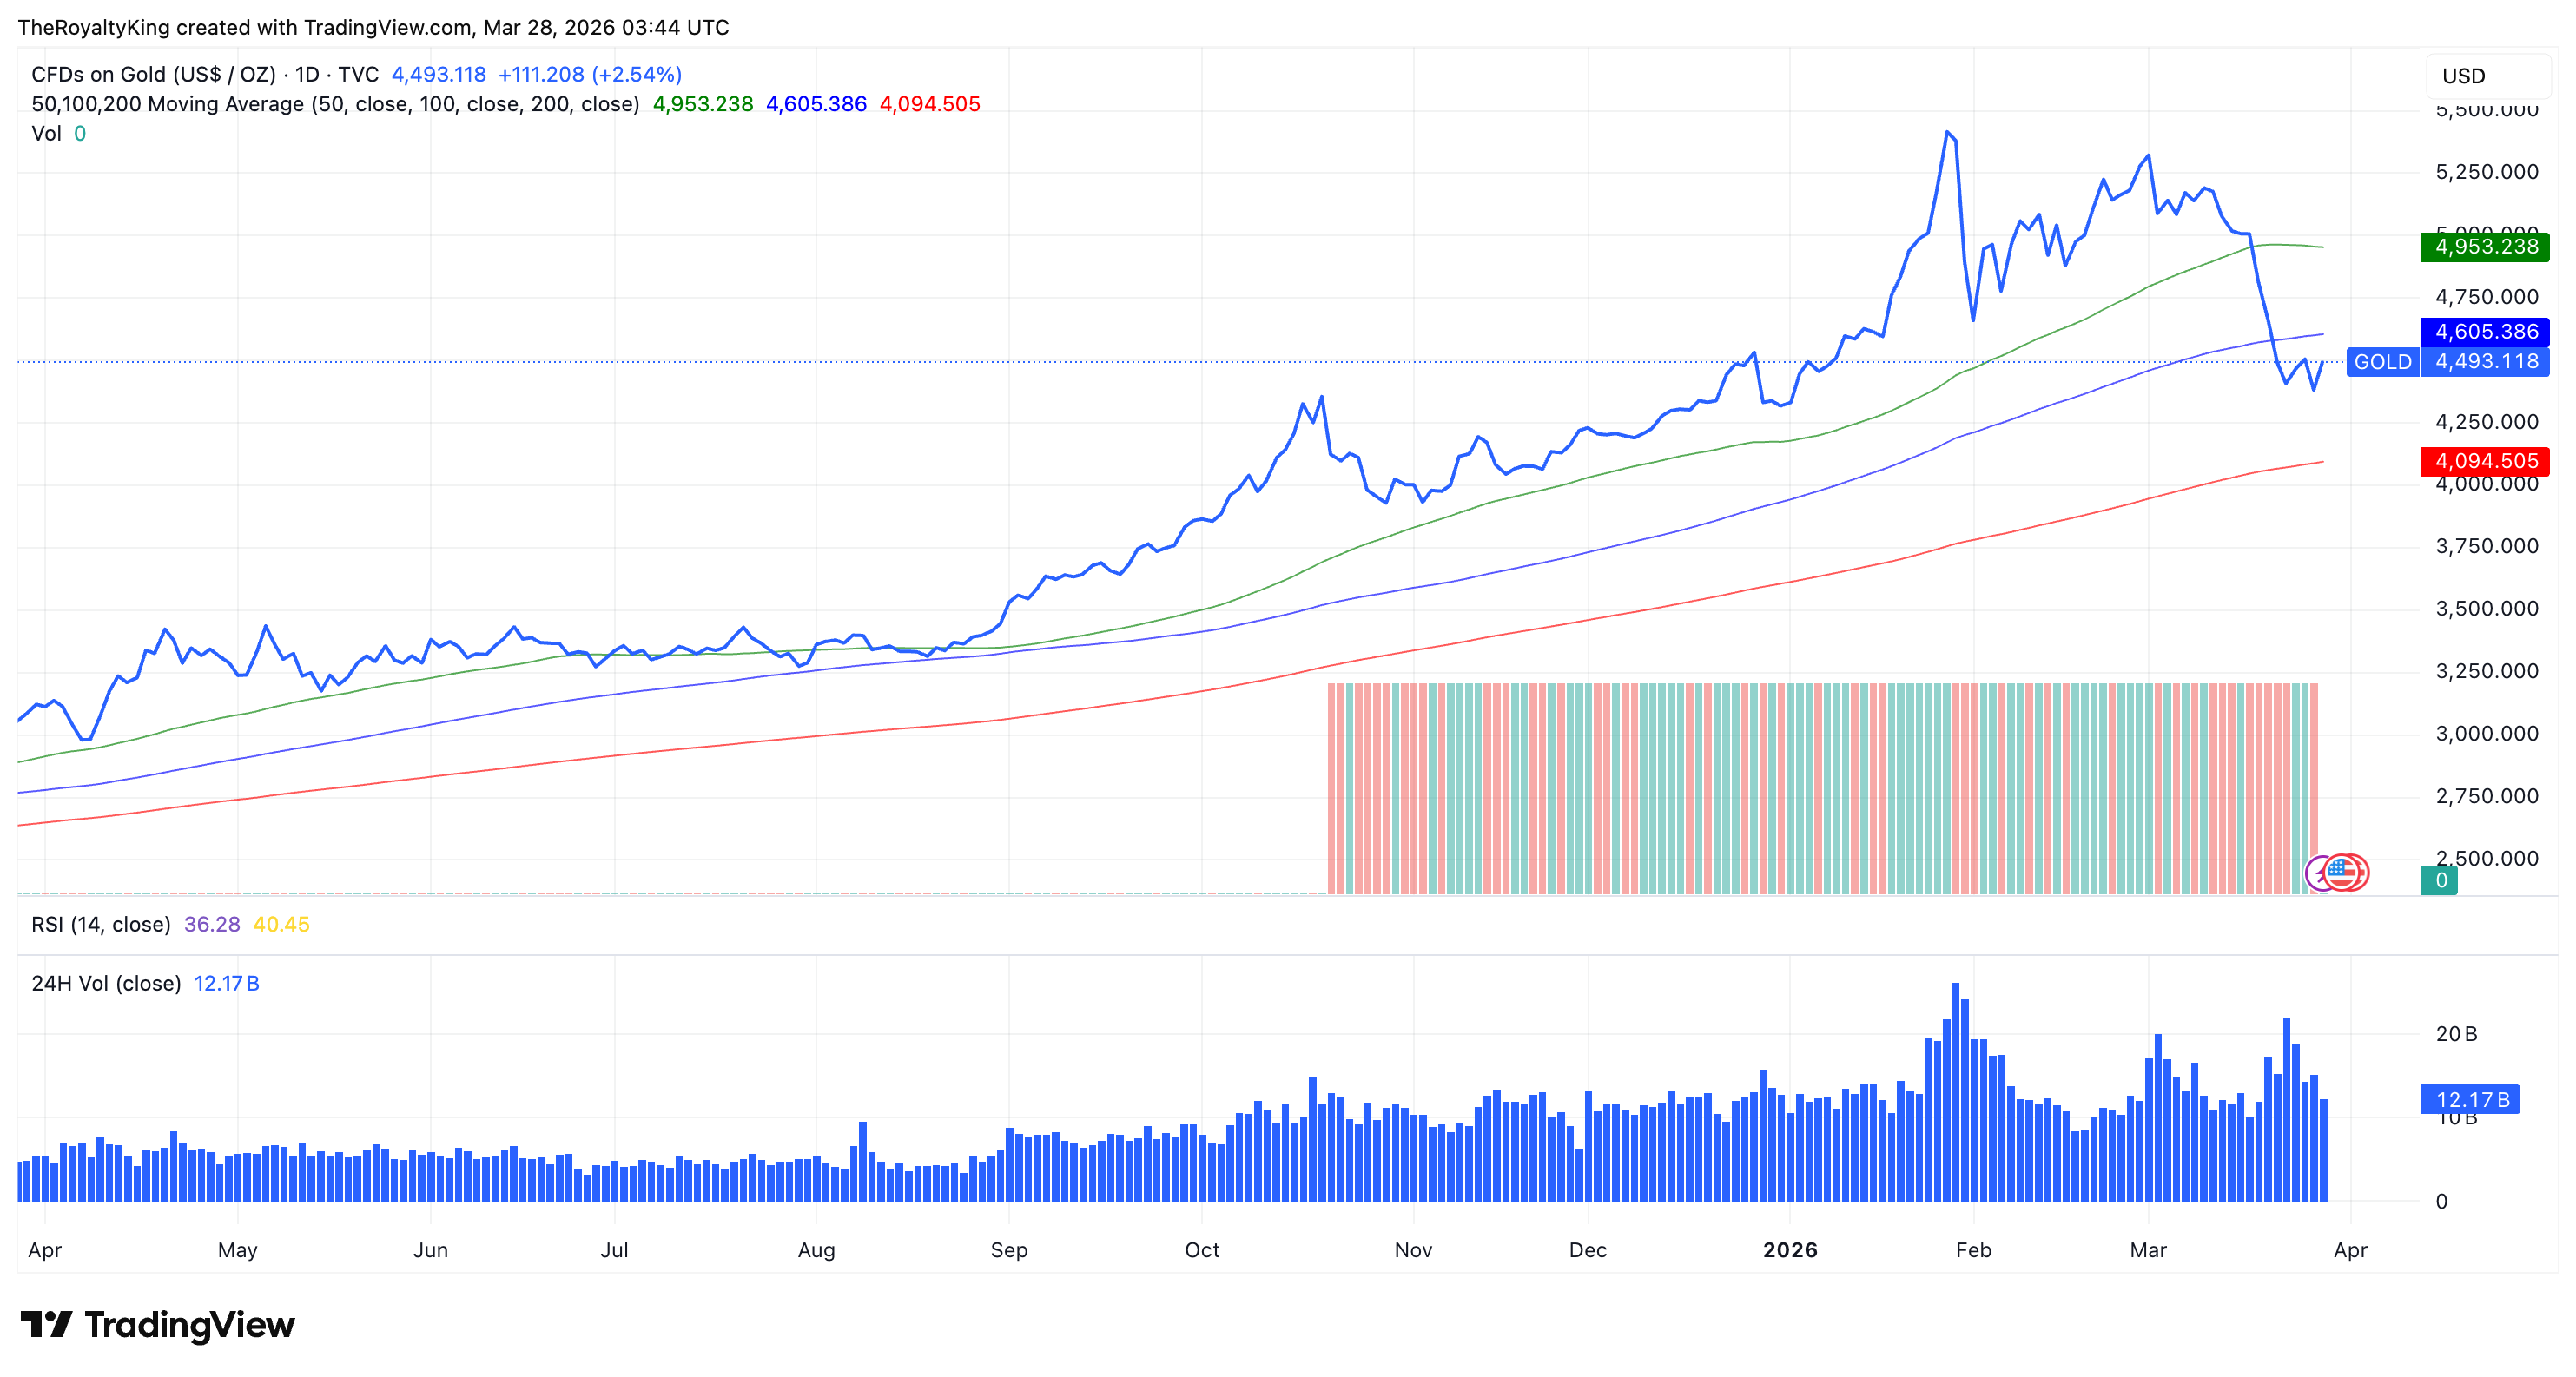
Despite the steep drop seen over the past week, the technical structure remains firmly bullish. Looking at the 50, 100 and 200-day moving averages on gold, three major pullbacks have occurred over the past year and none of them have meaningfully challenged the 200-day moving average.
Around the $4,400 level, support came in decisively. Selling volume spiked, including a $25.67 billion 24-hour volume day in January and $21.5 billion on the 23rd of March and buyers absorbed those flows entirely. That is a strong market.
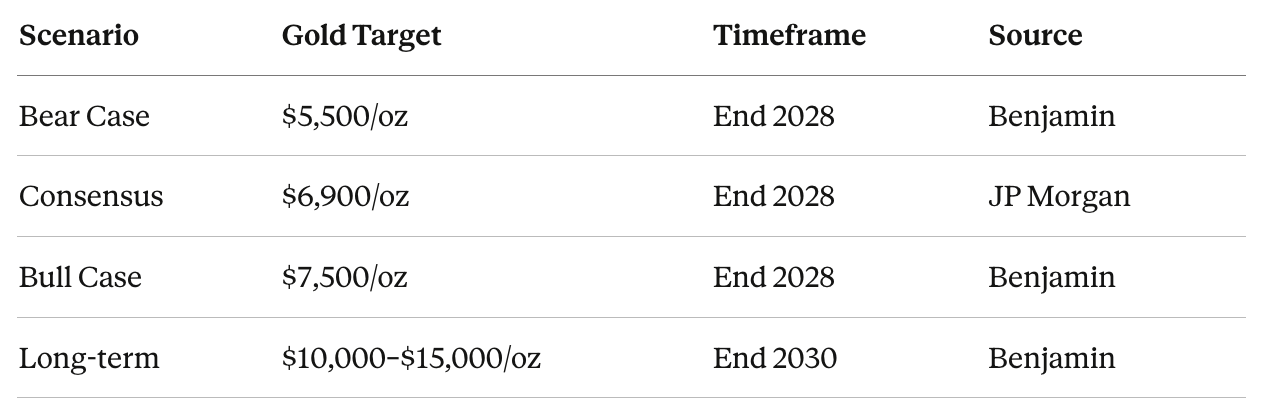
Price Targets:
I’ve left all profits from five years of gold savings in the position — that’s a free ride at this point. Initial capital has been pulled out and is being redeployed into leveraged vehicles: royalty companies and structured options spreads.
NASDAQ: A Technical and Macro Wreck
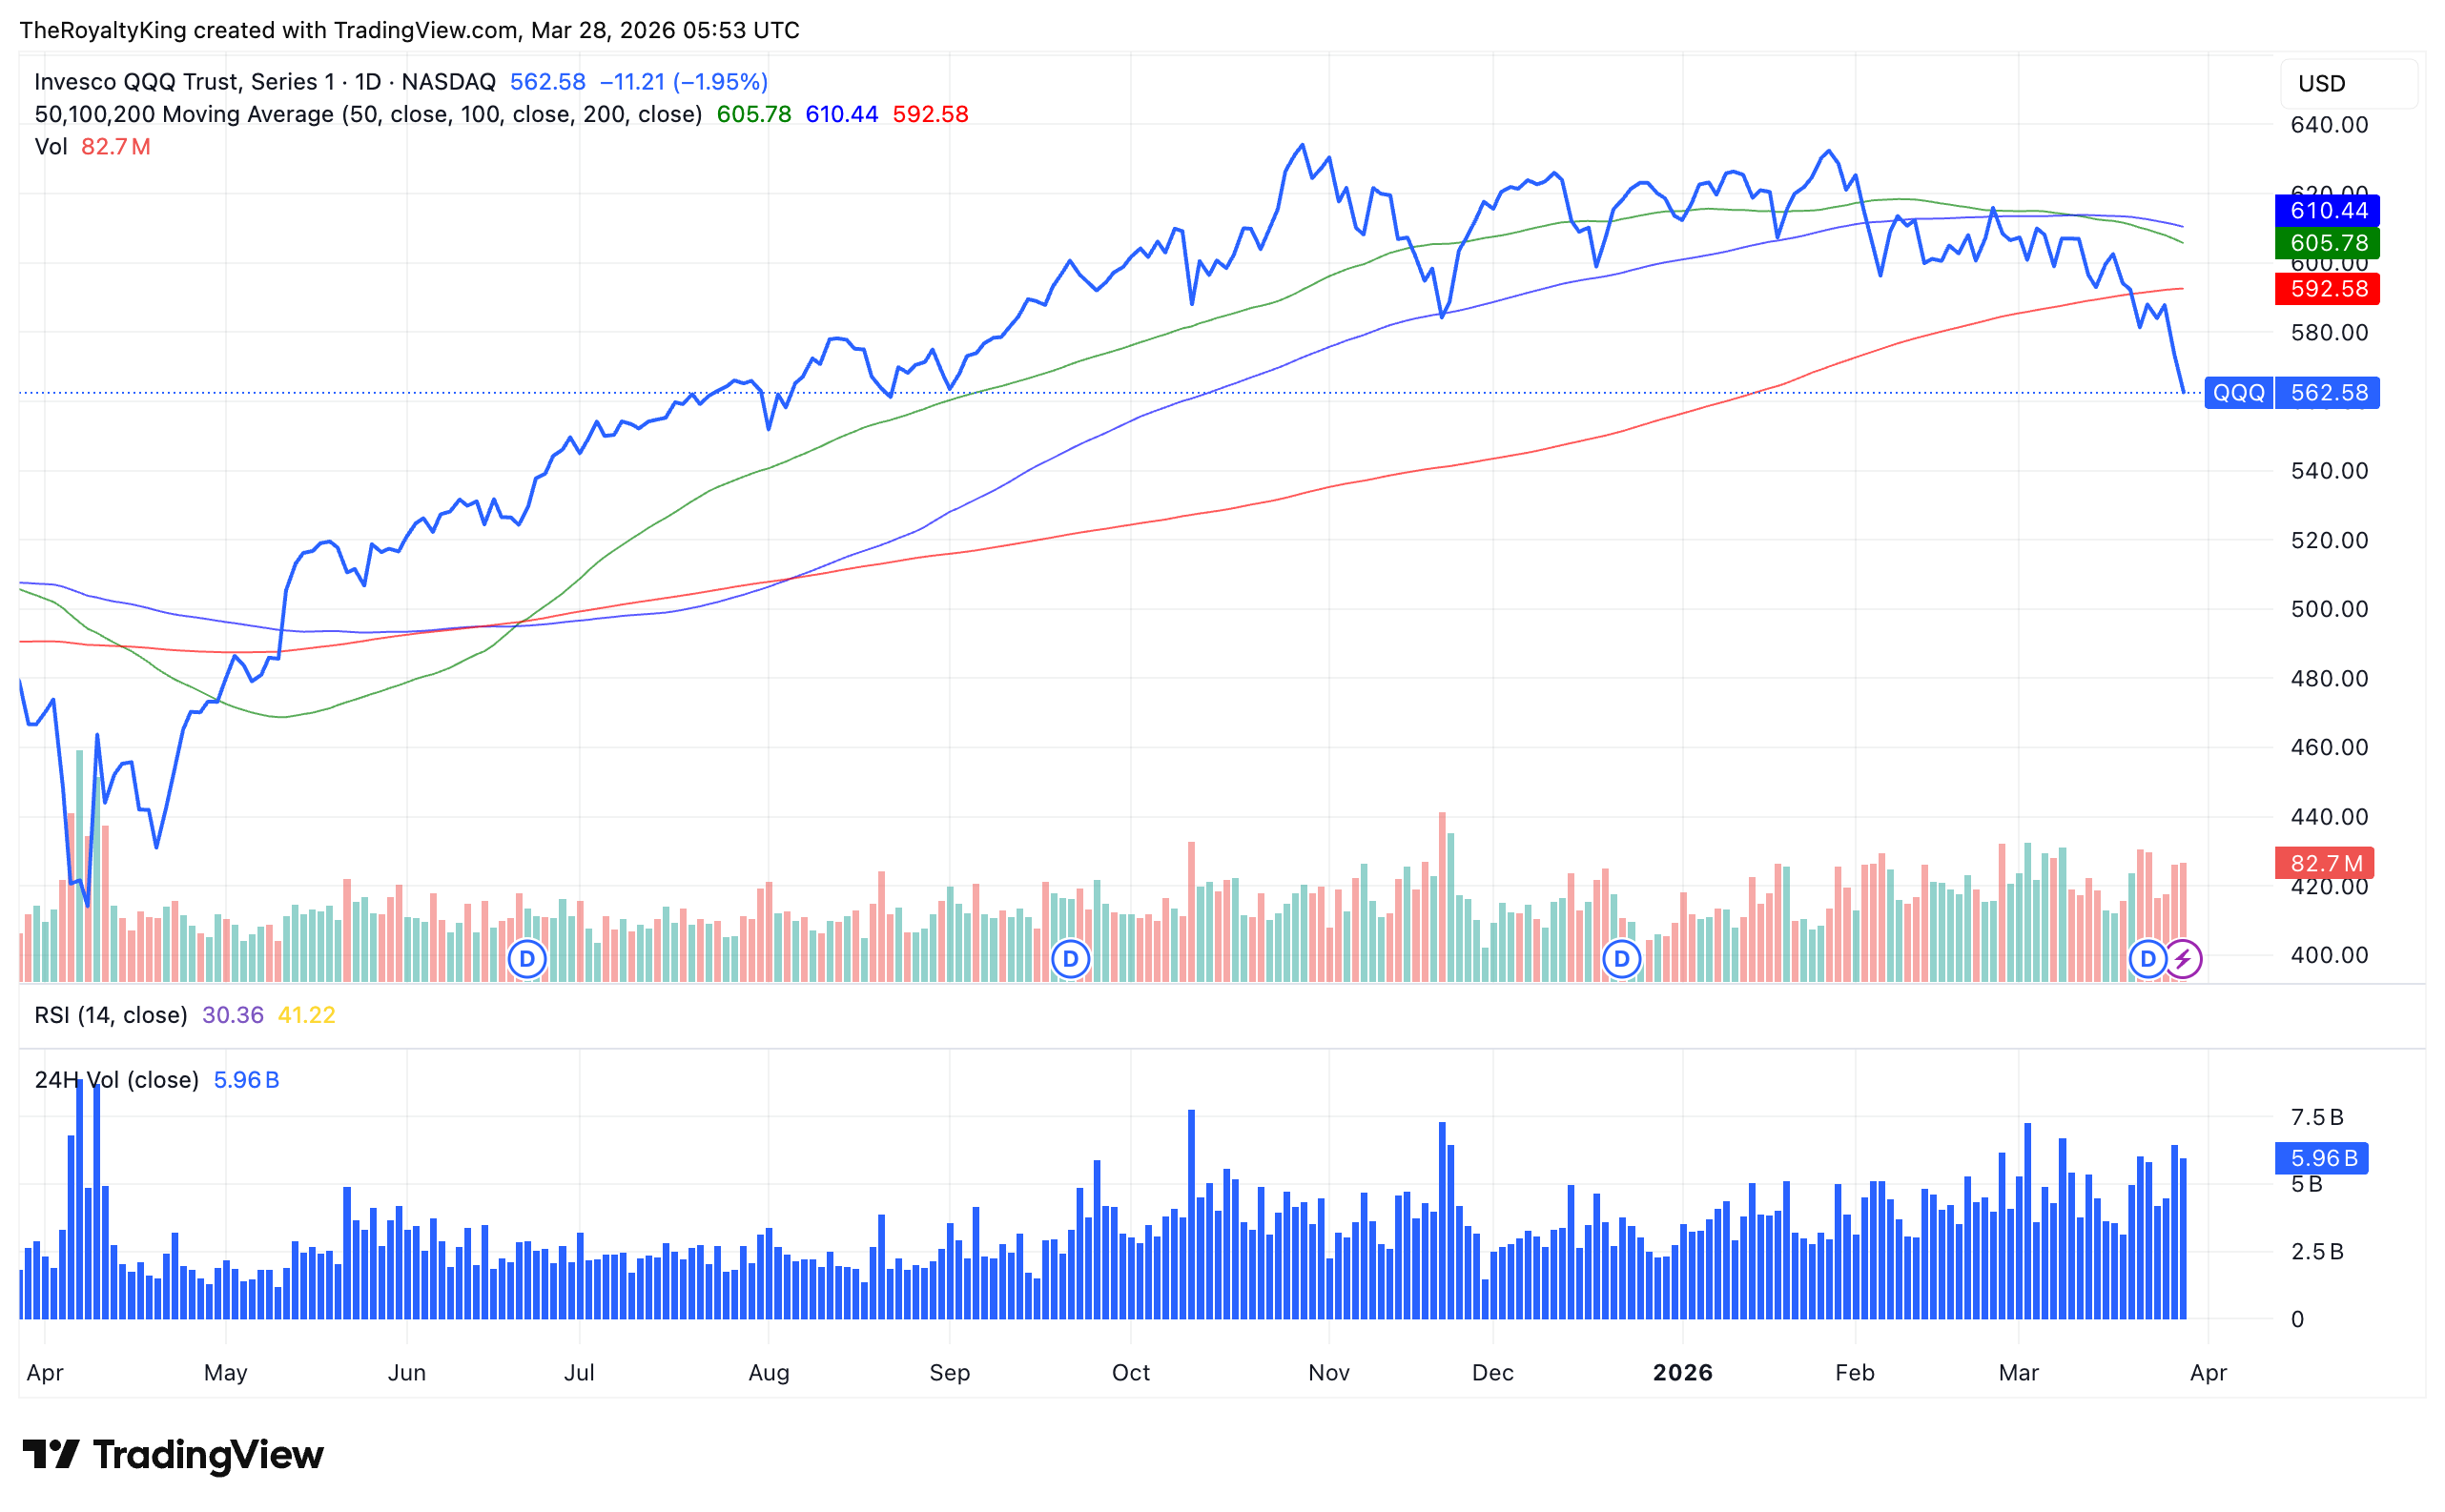
The NASDAQ (using QQQ as a proxy) has broken below its 200-day moving average and the move is not looking like a false breakdown. The 50-day moving average is now encroaching on the 100-day from above. If it crosses to the downside which is known as the death cross, algorithmic selling pressure will compound the move materially.
On the macro side: disruptions to traffic through the Strait of Hormuz, if sustained for another one to two weeks, will put the entire economy under pressure. Financials and tech i.e., the NASDAQ are the most exposed. Bond yields are likely to rise. Even gold miners could see near-term revenue impact if production is curtailed.
One silver lining in that scenario: exchanges may be misconstrued as financials and sold off indiscriminately. That would be a gift and an opportunity to add aggressively to the current holdings in the Croupier collection.
Gold Royalties vs. Gold: The Valuation Gap
There’s an interesting and under-appreciated dynamic playing out in royalty companies relative to gold itself. Looking at Groy (Gold Royalty Corp.) as a case study: since its IPO at ~$5, the stock dropped to $3 on post-IPO escrow selling, then to a low of $1.40–$1.50. Since end of 2023, the dollar price is up ~60% — impressive. But measured in gold terms, it’s actually down ~30%.
This is the opportunity. If you believe gold will substantially outperform fiat currency over the coming years (which I do), then royalty companies that have de-rated in gold terms represent a leveraged way to express that view without the operational risks of mining companies.
Masterclass: The In-the-Money Covered Call
Most covered call strategies sell options above the current spot price to generate a discount on entry while capping upside. This week I want to walk through a variation that’s less commonly discussed: the in-the-money (ITM) covered call — where the strike is below the current price. The logic is different and so is the risk profile.
The goal here isn’t maximum upside participation. It’s about locking in a profit spread that’s embedded from day 1 with meaningful downside protection in the event of non-assignment.
Here’s the first tranche of my planned trade I put on two days ago using Gold Royalty (GROY):
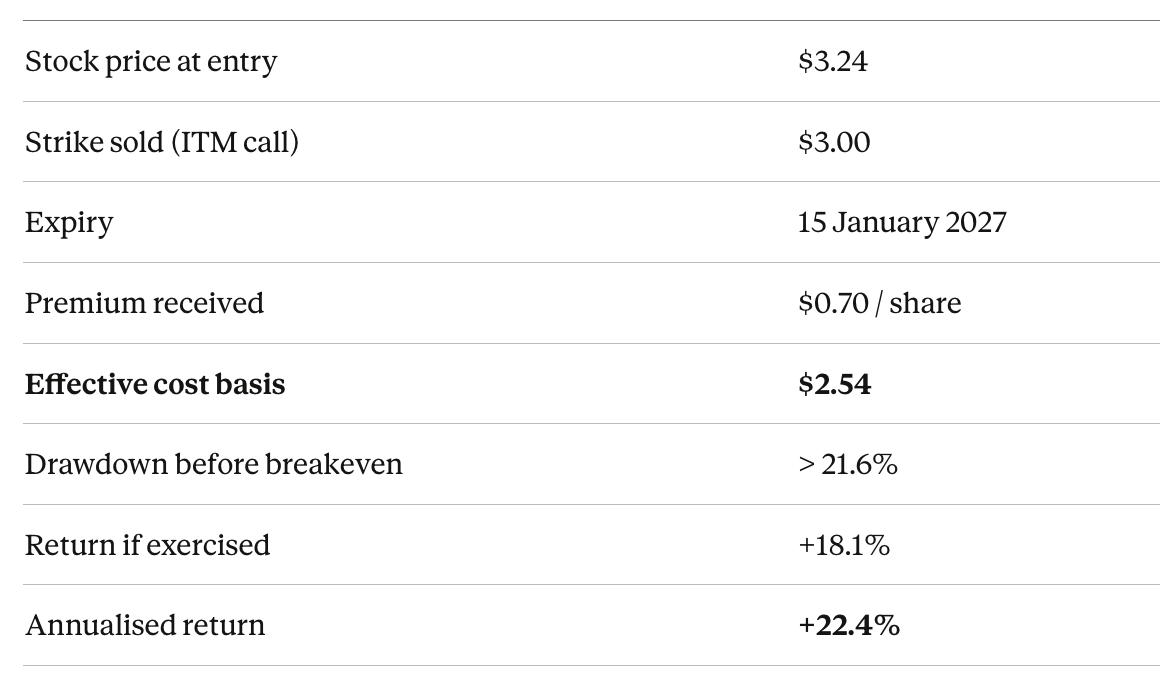
By selling the $3.00 call while the stock sits at $3.24, I receive $0.70 in premium. This takes my true cost basis down to $2.54. G-Roy last traded at $2.54 around July 2025 when the gold price was significantly lower than today. I'm effectively paying a July-2025 price for an asset in a considerably more bullish gold environment.
Two outcomes:
Scenario A — GROY above $3.00 at expiry: Option exercised, I sell at $3.00. Locked profit: $2.54 → $3.00, returning 18.1% / 22.4% annualised.
Scenario B — GROY below $3.00: Option expires worthless. I keep the premium and hold shares at an effective cost of $2.54. I’m happy to own more G-Roy at that level, especially relative to a gold price multiples above where it was when the stock last traded there. I can then write another call and collect rent again.
This targets 22.4% annualised on a royalty company with leveraged exposure to an asset I’m structurally bullish on.
Continue Reading
This is where the free portion of the weekly update ends. Premium members get the full trade breakdown on all five positions below, including the Gold options targeting 5x the performance of the metal itself with zero operational risk, the NASDAQ bearish option (targeting ~376% return by year-end), + options on LandBridge and NEXT.

