

Many have cast a cursory glance at the basic system presented in this publication and confused it with covered call writing.
That is wrong.
There’s nothing wrong with covered call writing and from time to time I too make use of it, but since it begins with buying common stock and selling an equal equivalent amount of calls it is erroneous to assume that the basic system used inside Machina is another version of this.
Let’s explore the tenets of the basic system and the distinction shall hopefully become clear.
Selling short (shorting) Overpriced Call Options and hedging with common stock.
This is the basic system in one line. Clearly it is philosophically and procedurally the opposite of covered call writing
Add in the all important ratio at which the options are sold short and hedge by going long the common and it becomes evident this is a different (and superior) strategy altogether.
The astute reader will have noticed the italics in the above bolded tab and naturally ask how to tell whether or not an option is over or underpriced. This is the central focus of today’s paper.
Most people look at an option price and see a number. I look at it and ask: is the market paying more/less than it’s worth?
That question is the whole basic system. Ed Thorp answered it in the 1960s with a chart he called the normal price curve. Once you can picture that curve, you can see which calls are overpriced and hence candidates for short selling.
This is the simplest way I know to explain it.
1. The Price Curve
Every option’s price is made of two parts.
Intrinsic value is what the call is worth if excercised right now: the stock price minus the strike, or zero if the stock is below the strike.
Extrinsic value, or time value. This is everything above the intrinsic value. It exists because a stock’s price will change over time hence, an out of the money option today may become in the money 6 months from now and hence this optionality is worth something — The price of time and uncertainty.
Eg: Imagine a $100 call option with 365 days to expiry, at 40% volatility priced in.
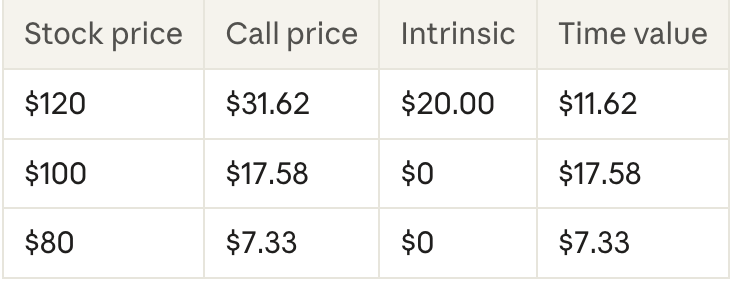
Notes:
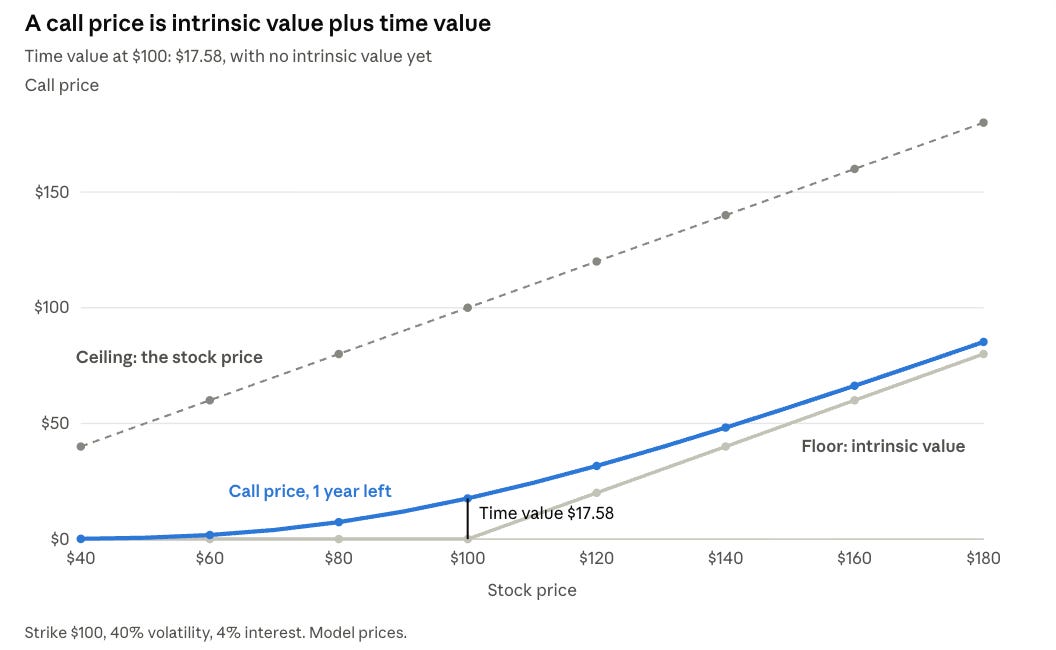
Along the bottom is the stock price; up the side is the call price. Three lines matter.
The floor is intrinsic value. A $100 call on a $140 stock is worth at least $40, because I could exercise it today and pocket the difference.
The ceiling is the stock price itself. No call can ever be worth more than the stock.
The curve is where call prices actually sit: Theoretically the expected value of all the stock price outcomes multiplied by their chance of occurring.
This is illustrative of how pricing should be made considering changes in stock price. But what about changes in time left to expiry?
2. Time Value
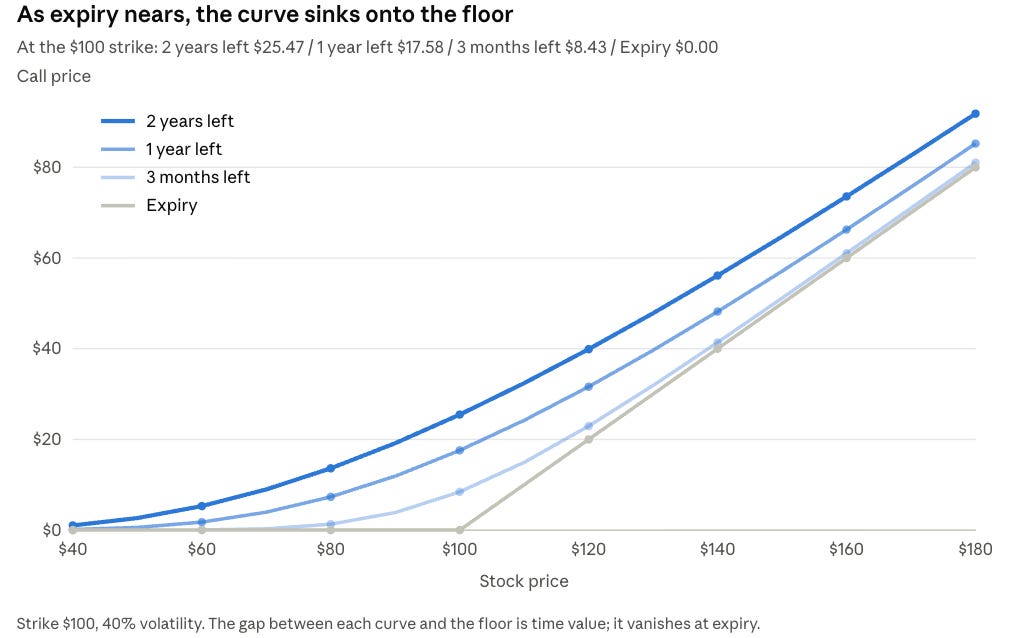
Simply put, the more time left in the life of an option contract the more it is logically worth as there is more time for the call’s strike to be realized.
As expiry gets closer, the curve sinks. At the $100 strike, the same call is worth about $25 with two years left, $17.58 with one year, $8.43 with three months, and nothing at expiry. That sinking is time decay, or Theta, and it speeds up at the end. It’s why Thorp found the short side earns fastest in the final months.
When I sell a call short, that falling curve is profit.
3. How the curve is calculated
Ed Thorp and Sheen Kassouf built their normal price curve from twenty years of real warrant prices. This database gave insight into answering the determining question:
At this stock price, with this much time left, what does a warrant normally sell for?
Thorp later created a formula that did this job and introduced it to Fischer Black in 1967. 6 years later Black and his colleague Myron Scholes had successfully tweaked it to account for interest rates and today that formula is the Black-Scholes formula that every broker in the world runs. It also now means the options are priced much more efficiently (within 365 days — outside of which mis-pricings are more frequently found as my friend Ferg mentioned in our recent chat ).
Black Scholes (Or Thorp-Bachelier if you’re a traditionalist like myself) runs on 5 inputs:
The stock price
The strike
The time left
The interest rate
Implied (Expected) Volatility: how much the stock is expected to move up until expiry.
The first four are facts. Implied Volatility is essentially an opinion. So the fair curve is really the price a call should have if the expected volatility eventually resemble realized vol. Naturally then, a higher implied (expected) vol means a pricier option. This can be exploited when the option is pricing in more volatility than will likely be realized.
4. Spotting an overpriced call
A call sitting above the fair curve costs more than the stock’s real movement justifies. Buyers are overpaying. That’s the call I sell.
Here’s a real one from my book. On 6 October, MIAX (Miami International Holdings) dropped about 10% in a day. Into that fear, I sold short the December 2027 $45 call for $3.24, with the stock at $31.30. That price implied about 48.5% volatility.
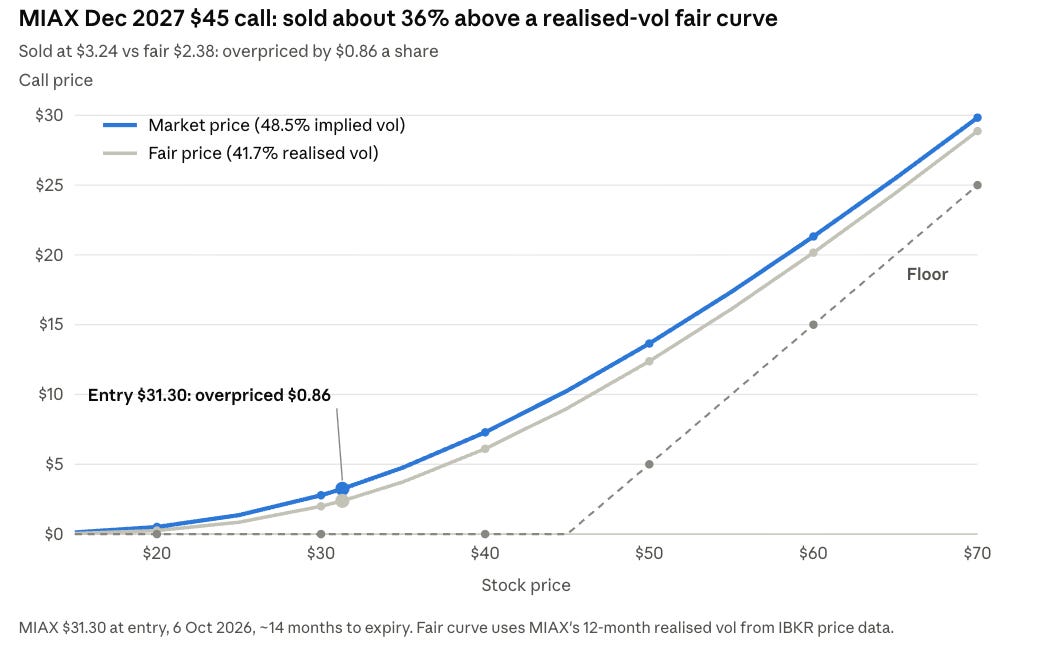
The volatility expectations appeared exaggerated. Over the previous year it had moved about 41.7% a year and 41% over the prior 3 months. At 41.7%, the fair price of that call was about $2.38. Hence buyers were paying ~$0.86 a share over the curve, making the calls 36% overpriced in normal terms.
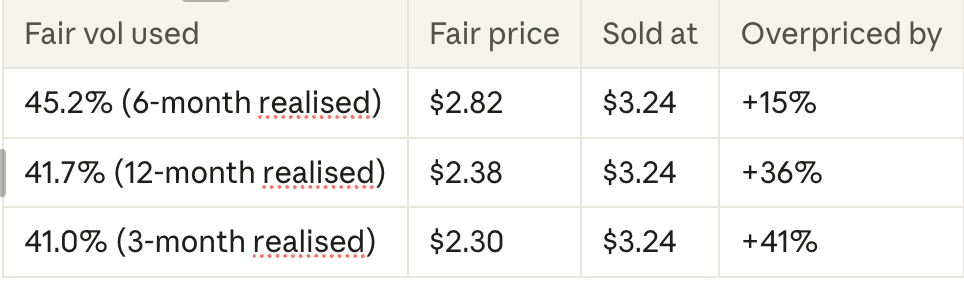
The call appeared rich by any measure. Yet a high implied vol isn’t automatically a good candidate for the basic system.
I check three things to decide whether a call is above the curve:
How much the stock actually moves. If implied vol sits above realised vol, the call is rich.
Its own history. Implied vol near the top of its 12-month range means it’s likely overpriced.
Other strikes and expiries. I sell the richest point on the curve I can find that also satisfies the entry criteria for the basic system.
The Basic System Checklist Pocket Card
Premium ≥ 6% of strike
Stock ÷ strike ≤ 1.2 (not too deep in the money?)
Expiry: <4 years, ideally 12–18 months, soonest expiry that passes (Theta Maxxing)
Above the fair curve (implied vol above realised vol)
5. Hedging With Common Stock
The system could theoretically be run short-only. And, in fact, in the study conducted by Thorp and Kassouf they compared their general system to only shorting overpriced warrants. Short only returned 22x over 17 years with highly erratic profits. Yet the general (basic) system outperformed it by 2.8x and would’ve saved a number of heart-attacks likely induced by shorting-only. The central point is that high profits do not have to entail high risk so hedging is only sensible IMHO.
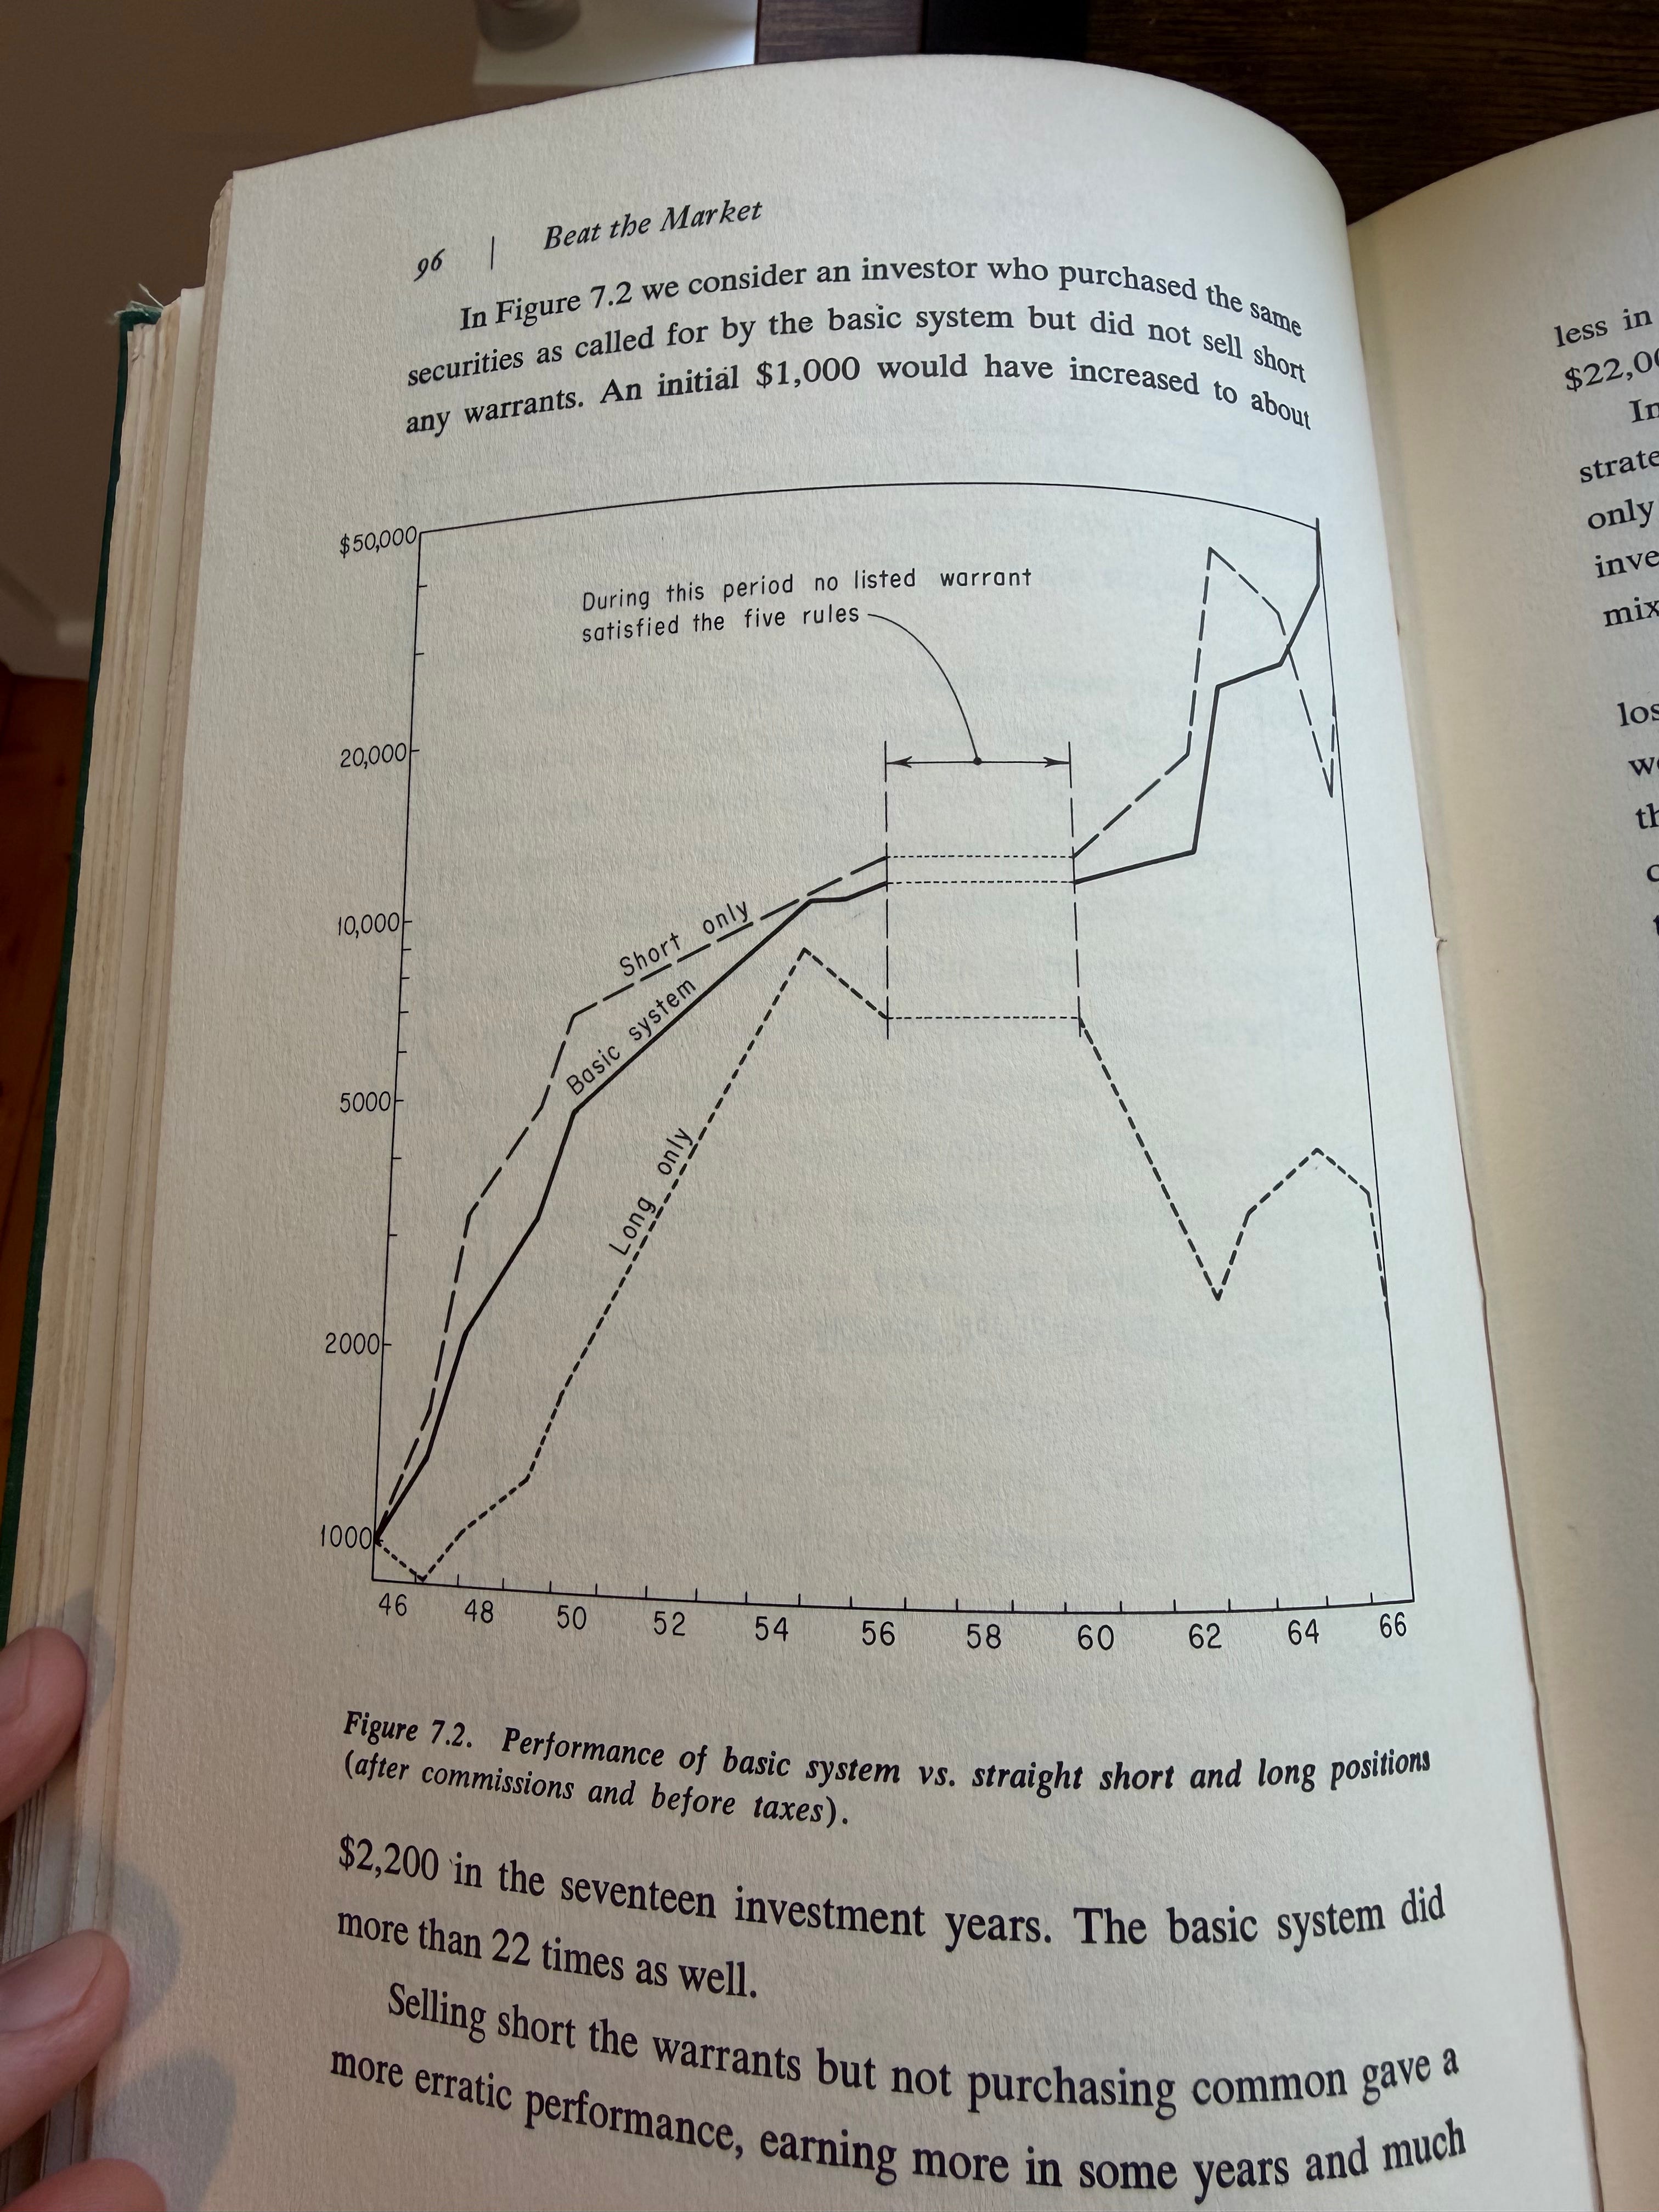
Real life eg: If I sold that overpriced MIAX call on its own, I’d be betting MIAX won’t rally past the strike price over the contract’s expiry. That’s a directional bet I don’t need to take.
Ergo I buy the common stock to offset or hedge the calls I sold short. What’s left is the mis-pricing: the extra premium shrinks back toward the fair curve, and then the whole curve sinks to the floor by expiry.
The question then is: how many shares to buy per call sold?
Finding the Optimal Hedging Ratio
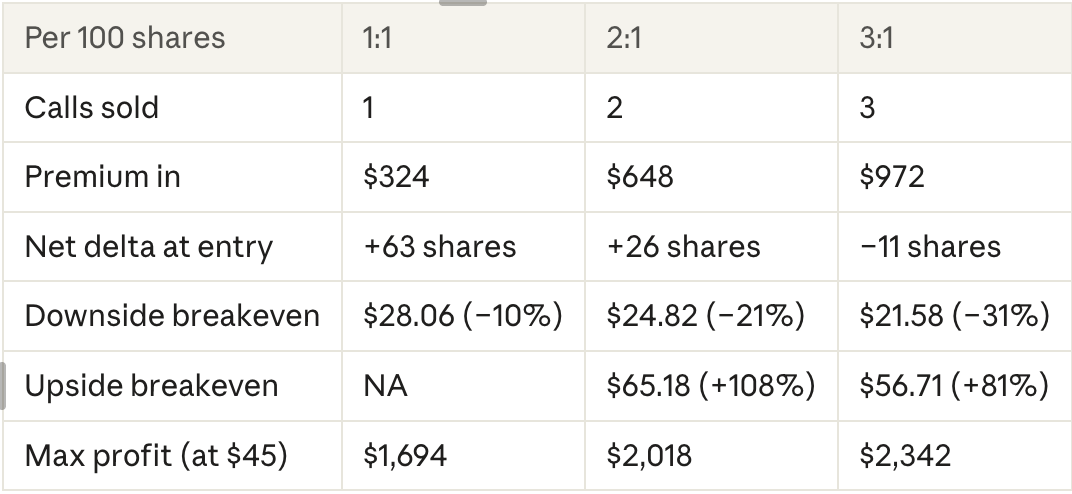
Here’s the same MIAX trade at three ratios, using the real data: shares at $31.30, Dec ‘27 $45 calls sold at $3.24.
More Visually:
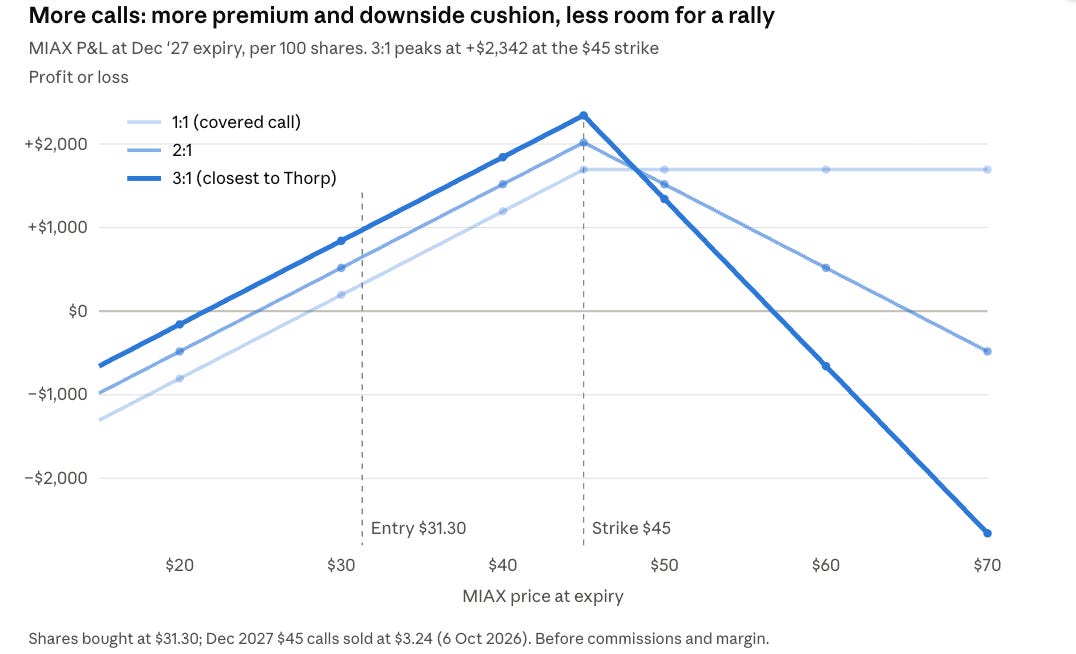
Best read thusly:
1:1 is functionally identical to an OTM covered call. It’s still mostly a bet on the stock: net long 63 shares, so I keep most of the downside.
3:1 is closest to Original Thorp. The delta ratio here is about 2.7 calls per 100 shares, so 3:1 is almost neutral. It collects three times the overpayment and makes money from a 31% fall to an 81% rise in MIAX stock price from date of entry. The risk is that a big rally, above about $57, costs money (assuming I don’t change my hedges)
2:1 sits in between: a wider upside, a narrower downside.
Model figures at expiry, per 100 shares, before commissions. Selling more than one call per 100 shares means uncovered calls, which need margin and carry theoretically unlimited risk above the upside breakeven.
In brief: The more calls I sell, the more of the mis-pricing I collect, and the less I depend on the stock’s direction. That’s the basic system in one sentence:
I don’t predict the stock, I collect the overpayment.
6. Two ideas for another day
The hedge doesn’t have to be common. In my Advanced System, a deep in-the-money call stands in for the shares as the hedge. It hugs the floor of the curve, so it behaves like the stock for far less capital.
Cheap calls flip the system around. A call sitting below the fair curve is cheap, and cheap volatility is something I buy rather than sell. That’s the reverse of everything above, and it deserves its own piece.
Summary
Every call price is composed of intrinsic value plus time value.
The fair curve is the price a call should have, given how much the stock really moves.
A call above the fair curve is overpriced, so I sell it.
I own the stock against it, so I’m paid for the mis- pricing, not for guessing direction.
Below, I walk through exactly how to do this with premium members.
For 20% of membership visit: https://www.machinacapitalis.com/Lifetimeredemption
Disclaimer: General information only. This piece is educational and reflects my own views and trades. It is not personal financial advice or a recommendation to buy or sell any security or option. It does not take into account your objectives, financial situation or needs. Consider whether it is appropriate for you, and speak to a licensed financial adviser before acting.
Disclosure. I hold positions in MIAX, CME and MSTR, including short call options, and may trade them at any time without notice.
Figures. Trade prices are my actual fills. Fair prices, payoffs and breakevens are model estimates based on historical volatility and Black-Scholes pricing; they ignore commissions, margin costs, dividends where noted, taxes and early assignment. Historical volatility does not predict future volatility, and past results are not a guide to future returns.
Risk. Options are complex and can lose money quickly. Selling more calls than you hold shares to cover creates uncovered (naked) call positions with theoretically unlimited loss if the stock rises sharply, and requires a margin account and broker approval. Only trade strategies you fully understand, with money you can afford to lose.